In a previous post, we saw a list of the top 250 offensive players in MLB history constructed by Principal Components Analysis (PCA), which transforms high-dimensional data to its lower-dimensional principal components while retaining a high percentage of the sample variation. The PCA projection of high-dimensional data onto a convenient lower-dimensional subspace allows accessible data visualization and provides an opportunity for data segmentation. Segmentation can add detail and structure to a PCA biplot like the one seen below for the reduced MLB players' career batting data.
In practice, it is quite common that PCA is used to project high-dimensional data onto a lower-dimensional space, then have the K-means clustering algorithm be applied in a PCA subspace. Below is the result of automatic segmentation of baseball hitters into groups by applying K-means clustering on the first few principal components that account for the lion’s share of the sample variance.
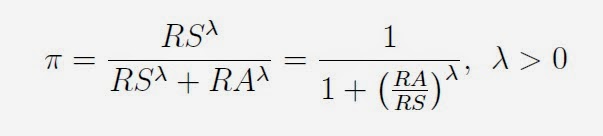
The so-called "Pythagorean Formula" was invented by sabermetrics pioneer Bill James in the early 1980's and is used to predict a baseball team's winning percentage on the basis of its runs scored (RS) and runs allowed (RA).
The exponent in James' original formula was lambda = 2, which reminded him of the Pythagorean theorem from Euclidean geometry, thus the name stuck. From a statistical perspective, the Pythagorean Formula is a logistic regression model where the response variable is a team's log-odds and the predictor variable is the logarithm of (RS/RA). Fitting a logistic regression model to a historical data set spanning the MLB seasons 1901-2013 gives a best fitting exponent of about 1.86.
Confidence intervals for a baseball team's winning percentage can be obtained by using a Scheffe-type simultaneous prediction band based on a fitted linear regression model that approximates the above logistic regression model. The formula for the confidence interval
is given below.
Here is my attempt at compiling a list of the best offensive players in Major League Baseball (MLB) history. I wanted this list to be determined by letting the data speak for itself. I started by constructing a dataset of career batting records from the Lahman Baseball Database using the SQL code found here. Data is based on the most recent version (2013 MLB Season) of this database.
My approach to building this list is based on Principal Components Analysis (PCA), a multivariate statistical method for reducing a large
number of possibly correlated variables to a few key underlying factors,
called "principal components", that explain the variance-covariance
structure of these variables. PCA can also be seen as a linear dimensionality reduction technique that projects high-dimensional data onto a lower-dimensional space without losing too much of the original data's sample variation.
I used PCA to derive a metric that I call Offensive Player Grade (OPG). Conceptually, the OPG is a statistic that grades players on a numerical scale and efficiently summarizes an individual player’s career offensive performance into a single number. My OPG statistic is a weighted average of both popular and esoteric (sabermetric) offensive statistics: Runs, Hits, Doubles, Triples, Home Runs, Runs-Batted-In, Stolen Bases, Caught Stealing, Bases-on-Balls, Strikeouts, Intentional Bases-On-Balls, Hit-By-Pitch, Sacrifice Hits, Sacrifice Flies, Grounded-Into-Double-Play, Total Bases, Runs Created, Batting Average, On-Base Percentage, Slugging Average, On-Base Percentage Plus Slugging Average, Total Average, Isolated Power, Secondary Average, and Runs Created Per Game.
Below is my list of the top 250 players in MLB history with respect to Offensive Player Grade (OPG).